
Supercharging the GTA VI website with Motion
Rockstar's beautiful GTA VI website could load even faster with Motion's deferred keyframe resolution and use of native browser APIs.

Rockstar has launched the new GTA VI website and it's a stunner. In particular, it uses scroll animations in a surprisingly engaging way, with some lovely gradients and masking. Check it out!
Obviously, when I see animations like this, the first thing I do is dig into the code to see if they're using Motion. In this case, Rockstar went with GSAP. And I'm not bitter about it! No way. Not this guy.
That said, I've been looking for a good hook to write about how Motion uses render batching and native browser APIs to improve performance. This is a great example, not only because it's timely, but also because it makes such extreme use of scroll animations.
After a bit of digging, I think using Motion would make a site like this up to a couple seconds faster to load. Which, in web performance terms, is technically termed "Quite a Lot".
Before I get into the whys, I would like to point out that not every stack choice comes down to startup performance. It could well be that GSAP offers some features that aren't present in Motion (just as the reverse is true). Or perhaps the per-frame performance was better, and that this was worth the trade-off for startup time.
In other words, this post isn't trying to make the point that GSAP is the "bad choice" and Motion is the "good choice". GSAP is an amazing library and the entire reason I began a career in web animations. Different projects have different requirements and it's our job to choose the right tool for the project - a job at which the team at Rockstar are in a better (and less biased!) position than me at doing.
With that out the way, let's do some profiling!
Why does this site load slowly?
When we load the GTA VI site, we spend some quality time with this (gorgeous) loading screen:

We can actually notice that the animation here pauses for up to a few seconds. What's causing this pause? Opening up the performance panel reveals this graph:
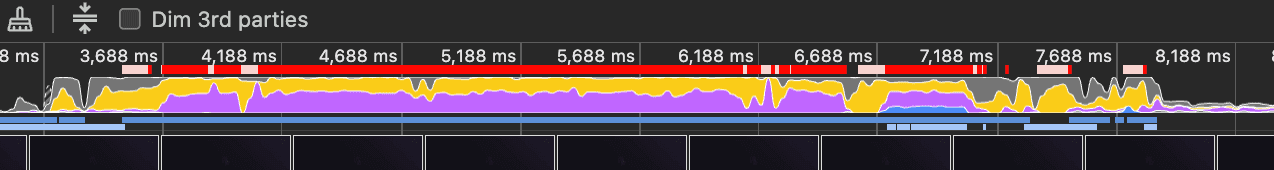
Like a toddler's interpretation of a Wes Anderson movie, here we have three predominant colors.
-
Yellow: Time spent running JavaScript
-
Purple: Time spent on style and layout calculations
-
Red: Low frames per second (FPS)
The red bars are essentially the product of the yellow and purple bits. More JS and style/layout calculations = a clogged main thread = low FPS.
In general, we want to avoid low FPS as it means our interfaces become unresponsive. Arguably, this is a loading screen, so does it matter? The thing is, the sooner we get this work out of the way, the sooner the user can use the site. So it's still good to minimise this work.
By zooming into the work being performed, we see this:
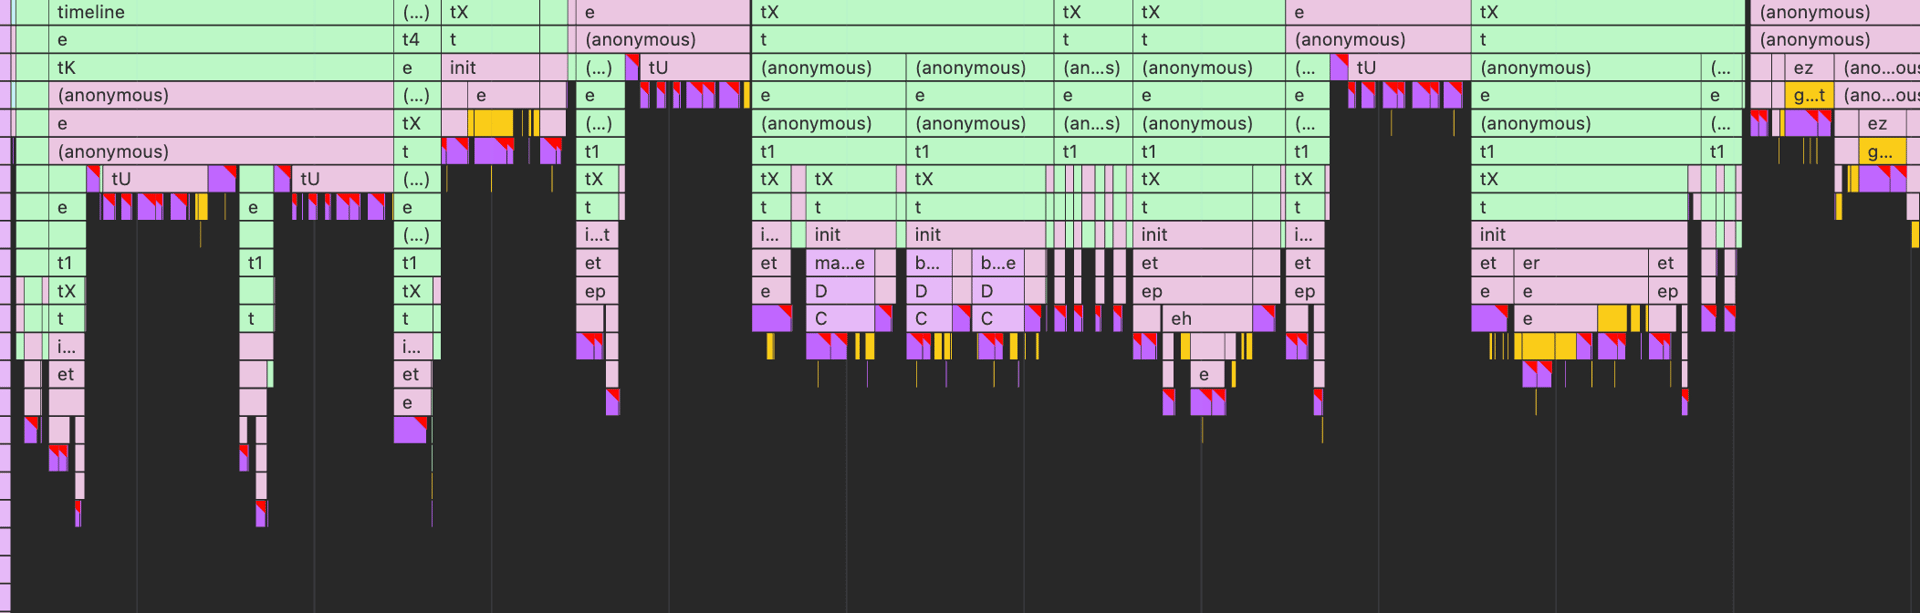
Those bits of purple with red are the style recalculations. There's so many tiny recalculations because the page is being thrashed.
Thrashing 101
When we talk about "thrashing" the DOM, we're referring to writing and reading styles and/or layout over and over again, in quick succession.
Here's a stupid yet practical example. Let's say we want to measure the size of a DOM element, in pixels, after setting its width. A naive implementation might look like this:
function measure(element, width) {
  element.style.width = width // Write styles
  return element.getBoundingClientRect().width // Measure DOM
}
If we call this function once, we write to the DOM, then measure it.
measure(elementA, "50%") // Write, read (RECALCULATE)By writing to the DOM, the browser needs to perform style and/or layout calculations. The browser is normally smart at batching this work into as few jobs as possible. But when we subsequently read from the DOM, we force this work to happen early. A forced recalculation.
We could call this function an unlimited number of times, triggering multiple forced recalculations.
const aWidth = measure(elementA, "100vw") // Write, read (RECALCULATE)
const bWidth = measure(elementB, "50%") // Write, read (RECALCULATE)
const cWidth = measure(elementC, "20%") // Write, read (RECALCULATE)
To make matters worse, we might mix this measure function in with a bunch of others that also read or write to the DOM, all spread across hundreds of "isolated" components that, when put together, brew a performance nightmare.
From profiling the GTA VI site, we can see a number of different functions all interleaved, triggering immense thrashing, sourced from both GSAP and Rockstar's own code. These functions perform tasks like:
-
Reading initial styles
-
Resetting and measuring elements without
transform -
Measuring viewport height
-
Measuring total scrollable area
-
Pinning elements
-
Converting between units (i.e.
px<->%) -
Reading/writing scroll position
Many of these functions aren't like our example above, which both reads and writes. They might only read, or only write. But when they become interleaved, these become part of the problem.
Most of these functions are being called hundreds and even thousands of times - that's a lot of thrashing!
How to fix thrashing
Motion employs two main strategies to reduce or remove thrashing: Batching, and doing less.
Batching
Batching is the process of rounding up all your reads, and all your writes, and doing them all together.
Let's unroll our previous measure example and do all the writes first, then all the reads.
// Writes
elementA.style.width = "100vh"
elementB.style.width = "50%"
elementC.style.width = "20%"

// Reads - RECALCULATE
const aWidth = elementA.getBoundingClientRect()
const bWidth = elementB.getBoundingClientRect()
const cWidth = elementC.getBoundingClientRect()
You can see that in this version, there's only one recalculation. Great! Except we've only batched three calls to one function, and as we saw before, on the site there's a broad range of different functions called hundreds or even thousands of times. Writing them in this way isn't feasible.
This is where Motion's frameloop comes in.
Frameloop
While active, Motion's frameloop runs as a single requestAnimationFrame callback that splits tasks into reads and writes.
Essentially:
const process = () => {
  readAll()
  writeAll()
}

requestAnimationFrame(process)
Practically, on rare frames we do a few more steps than this, but that's the gist.
This frameloop is exposed as an API, frame, that developers can tap into. So the previous measure callback could be re-written as:
function measure(element, width, callback) {
  frame.setup(() => {
    element.style.width = width

    frame.read(() => {
      callback(element.getBoundingClientRect())
    })
  })
}
Batching reads and writes using frame or a similar batching API like fastdom is good practise to reduce style thrashing, and every read/write inside of Motion is batched in this way (or similar).
We can use this batching to remove thrashing from some of the tasks we saw before, namely reading initial values and unit conversion. This is where Motion's deferred keyframe resolution comes into play.
Deferred keyframe resolution
Imagine we call two animations, one after another:
animate("#container", { opacity: 1 })
animate("ul", { width: ["100px", "50%"] })
They look innocent enough, but they each contain a trap.
-
We're animating
opacityto1, but from what? If this is the first time we've animated this element, we must read the initial keyframe from the DOM. -
We're animating
widthbetweenpxand%. We need to convert these unit types to interpolate them.
So the opacity animation contains a read and then the width animation contains a write, a read, and potentially another write to reset the element to its initial state.
Most libraries will perform all this work synchronously, but in Motion we defer the resolution of these keyframes until the following animation frame, and batch all these reads and writes.
Doing less
The alternative to doing all this work efficiently is to not do the work at all.
Motion is unique in that it runs on a hybrid engine. That is, a mix of JavaScript animations and native browser animations. When something can be done more performantly by the browser, we let the browser do it. Where the browser has limitations, we use JavaScript.
Looking at the list of functions from before, we can see "pinning" as one of these. When GSAP originally added pinning, this wasn't something browsers could do natively. Now though, position: sticky can handle 99% of the same use-cases, for free, eliminating a whole class of thrashing.
Other browser APIs can help us further.
ScrollTimeline
In browsers that support it, Motion will use ScrollTimeline to power scroll-driven animations via its scroll function. This even works for arbitrary functions:
scroll(progress => console.log(progress))This removes a whole bunch of measurements, like needing to measure scrollable areas, or measuring scrollTop every frame. But this code will gracefully fall back to using measurements in browsers that don't support ScrollTimeline.
Additionally, when animating values that can be hardware accelerated, like opacity, transform and filter, this whole scroll animation will run off the main thread for even more performance improvements:
scroll(animate(element, { opacity: [0, 1] }))In the next few months, we also plan to leverage ViewTimeline for element-based tracking.
IntersectionObserver
The GTA VI site also uses ScrollTrigger for starting animations when they enter and leave the viewport.
Many libraries will use scroll tracking to determine when elements enter or leave the viewport. This can have its benefits, for instance only considering the intersection of a single axis when determining if an element has fully entered the viewport.
However, the browser already has an API for detecting elements leaving and entering the viewport, IntersectionObserver. Motion uses this in its inView function, which can fire code as elements enter and leave the viewport.
inView(element, () => {
  animate(element, { opacity: 1 })

  return () => animate(element, { opacity: 0 })
})
The nice thing about this approach is when dealing with so many animations on a single page, this is a great way to lazily initialise animations so they only resolve once they're within the viewport. This can have a dramatic effect on startup times and improve per-frame performance.
Results
To test the difference between the two approaches, I made a couple test files that created 500 elements with a scroll animation and 50 elements with pinning.
The code had a mix of unseen values to trigger reads for initial keyframes, as well as some unit conversion for width. It's a little hacky in terms of the output animation but the point is just to trigger these jobs.
// GSAP
containers.forEach((container) => {
  gsap.to(container.querySelector(".box"), {
    rotate: Math.random() * 360,
    backgroundColor: "#f00",
    width: Math.random() * 100 + "%",
    duration: 1,
    scrollTrigger: {
      scrub: 0,
    },
  })

  const pin = container.querySelector(".pin")
  if (pin) {
    gsap.to(pin, {
      rotate: 20,
      scrollTrigger: {
        trigger: pin,
        pin: true,
      },
    })
  }
})

// Motion
containers.forEach((container) => {
  scroll(
    animate(container.querySelector(".box"), {
      rotate: Math.random() * 360,
      backgroundColor: "#f00",
      width: Math.random() * 100 + "%",
    })
  )

  const pin = container.querySelector(".pin")
  if (pin) {
    scroll(animate(pin, { rotate: 20 }))
  }
})
The results show the power of reducing layout thrashing and leaving more jobs to the browser.
GSAP:

Motion:

The overall time spent is 90% less. When broken down, JS execution is less than half, but the real winner is rendering, which is down from 1200ms to 20ms.
To be clear, I should reiterate that I'm not arguing that Motion is the best choice for all websites, or even the best choice for this one. There are a ton of various factors to consider. But hopefully I've highlighted some of Motion's architecture choices and the specific benefits that these bring towards startup time.